SmartProbe for customers
Everything you can do with SmartProbe
This page is for teams already running SmartProbe. Below is a quick guide to the main features, how to use them, and where to go when something needs attention.
Core monitoring
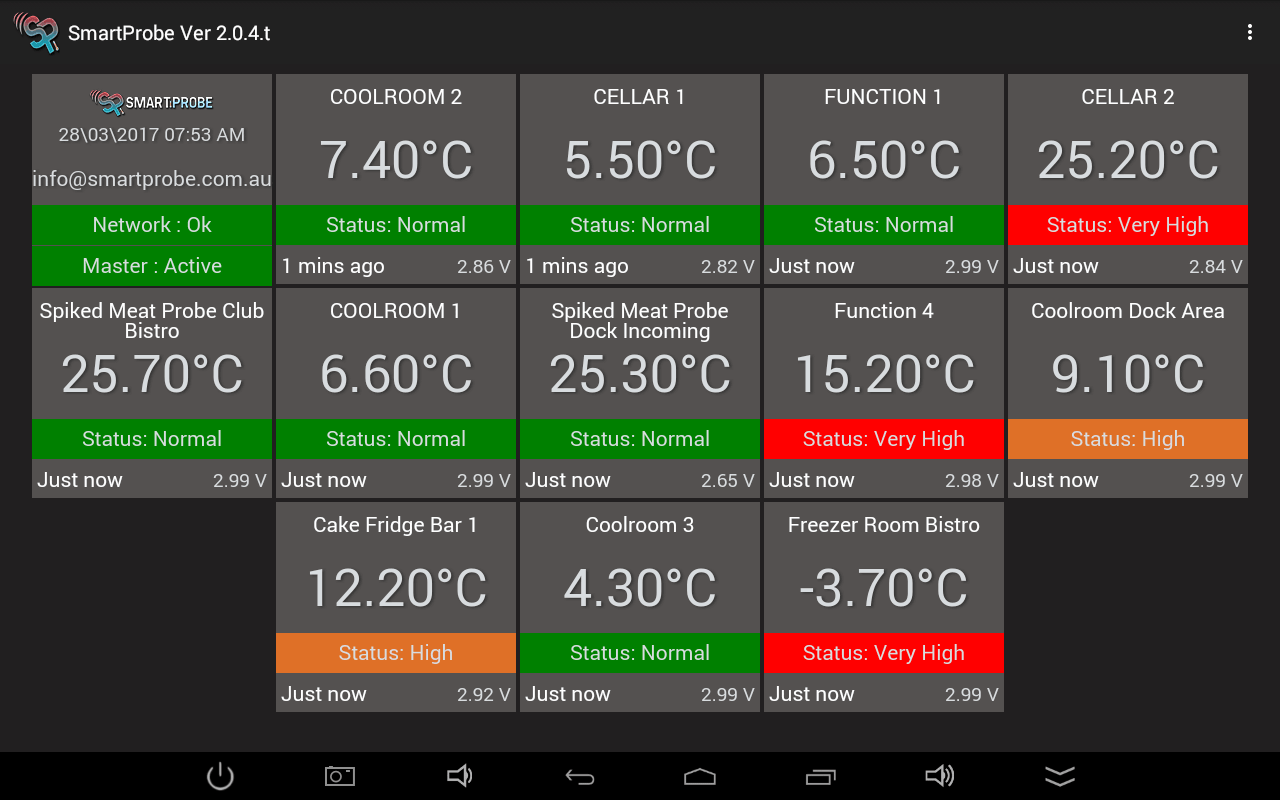
Real-time visibility
- Live temperatures with automatic sampling and retention in readings_utc.
- Alarms by SMS/email/on-screen when thresholds are breached.
- Offline cushioning: data caches on device and backfills when connectivity returns.
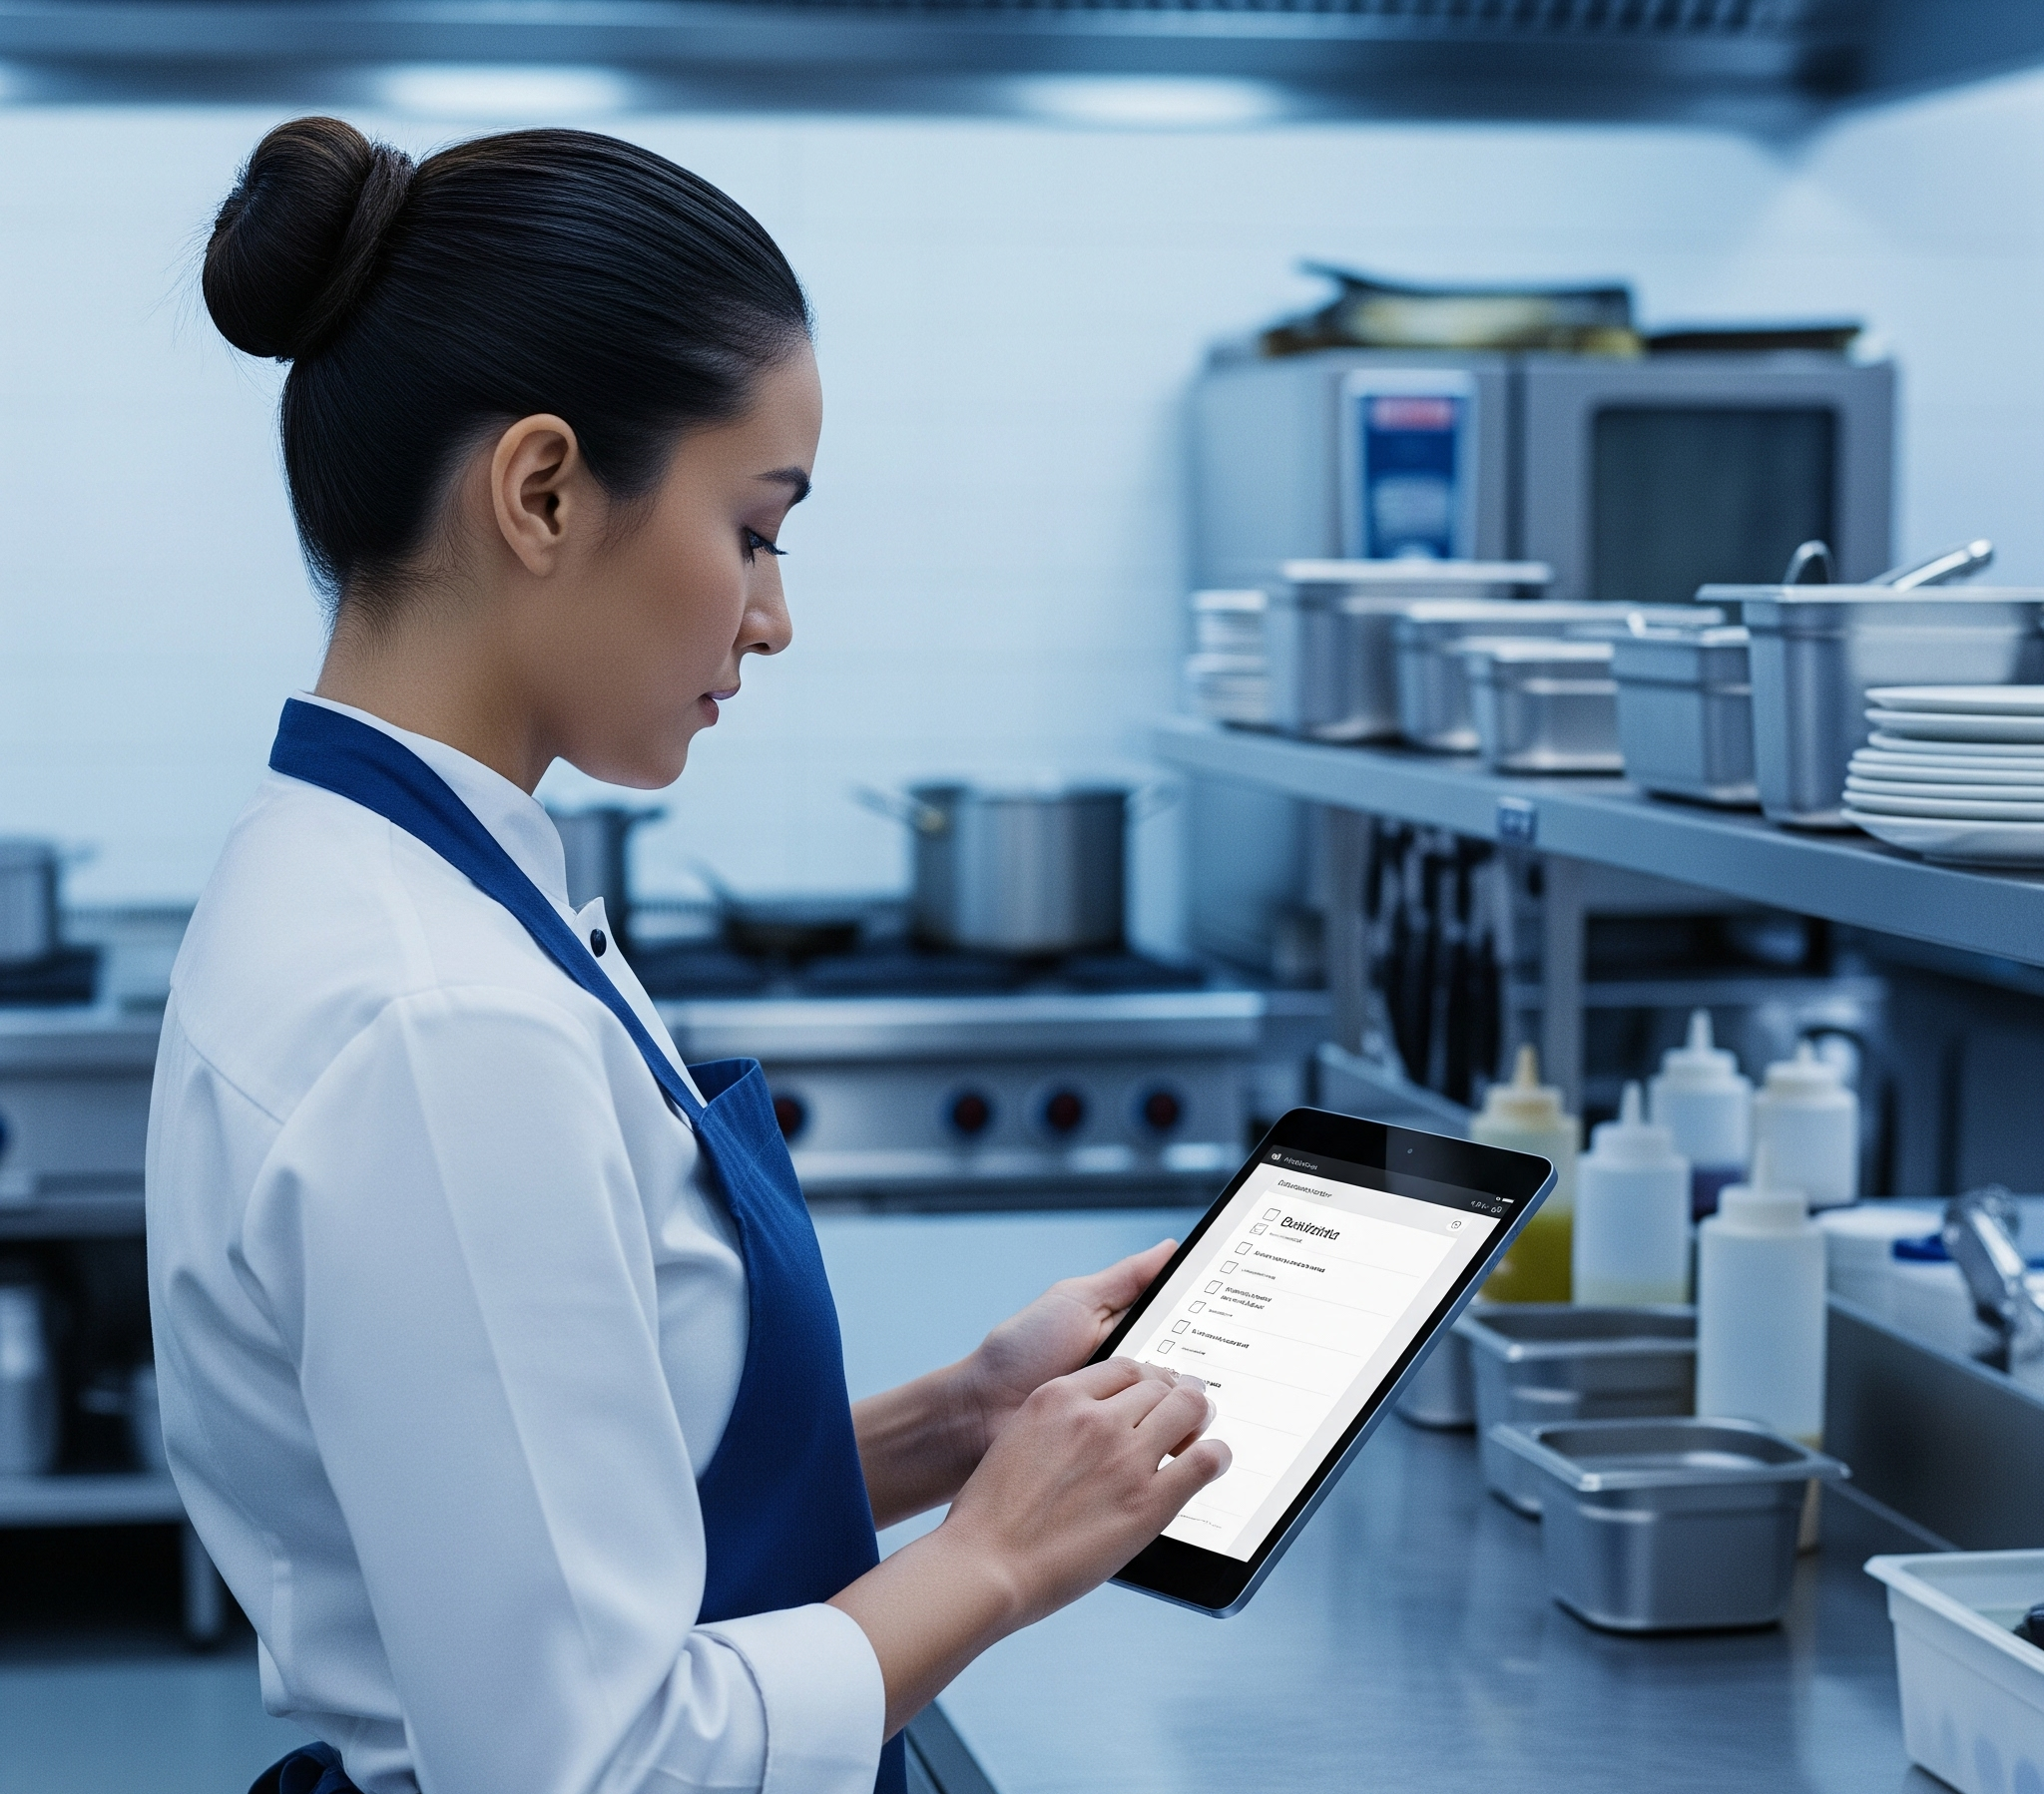
Tasks & workflows
Digital checklists and corrective actions
- Scheduled tasks with timestamps and accountability for each site.
- Automatic corrective actions when readings exceed limits.
- Cook-chill guided flow: start, probe, log, and export the report in one pass.
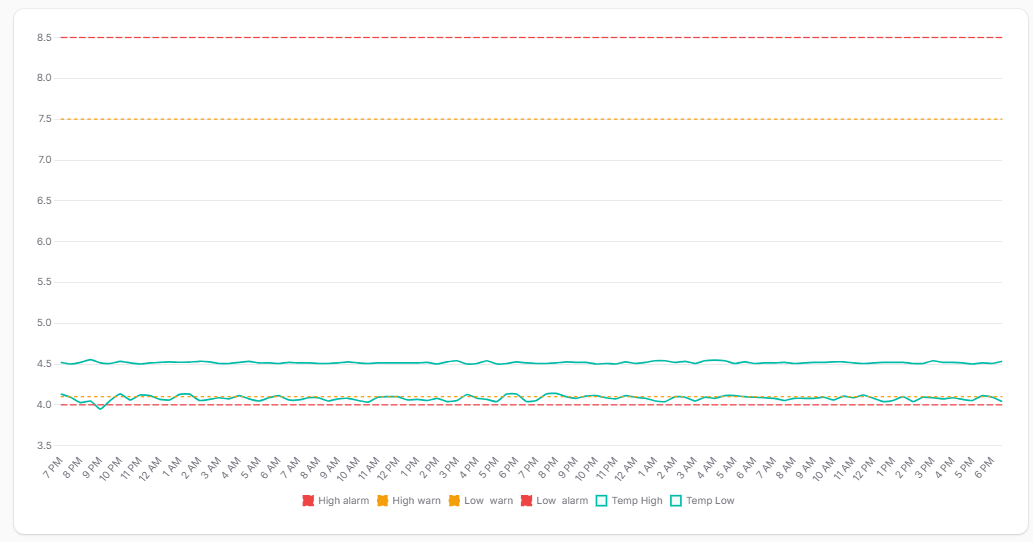
Reporting & audits
Evidence on demand
- Tables and graphs for trend analysis across devices, channels, and locations.
- CSV/PDF exports for inspections and internal audits.
- Latest log snapshots per device to see what changed last.

Multi-site & roles
Control at scale
- Tenant/organisation level overview with per-location drill-down.
- Role-based access for managers, auditors, and operators.
- Device/location mapping with time zones handled automatically via device_tz_map.
How to
Daily use checklist
- Check Today view for any alerts or overdue tasks.
- Acknowledge alarms and add notes/corrective actions if required.
- Complete scheduled checklists; attach photos if needed.
- Verify latest logs for critical fridges/freezers before close of day.
Fast tips
- Silence an alarm only after recording the corrective action.
- Use filters to focus on a location, device, or date range.
- Exports pull the exact filters you set—set them first, then export.
Add a new device
- Power on the probe and confirm it reads SP-serial on the label.
- In Devices, click Add, enter the serial (SP-xxxx), assign tenant/location.
- Optionally set thresholds and default channel; save.
- Wait for first heartbeat/log to validate connectivity; check Latest Logs.
Handle an alert
- Open the alert detail to confirm device, channel, and timestamp.
- Take corrective action (move product, adjust settings, calibrate).
- Record the action and mark the alert as resolved.
- If recurring, adjust thresholds or sampling rate for that device.
Export logs & reports
- Go to Logs; set filters for date range, location, device, channel.
- Preview in table/graph to confirm the scope.
- Click Export and choose CSV or PDF.
- Share exports directly with auditors or attach to tickets.
Cook chill workflow
- Insert SmartProbe and start Cook Chill from the Tasks view.
- Follow prompts to log start/end temperatures and times.
- System generates the cook chill report automatically.
- Export or attach the report to your HACCP records.
Troubleshooting quick wins
- No new readings: check probe power, connectivity, and that the serial matches Devices.
- Timezone seems off: run telemetry:warmup-tz-map (admin) or update device/location tz.
- Alert storm: confirm thresholds and sampling rate; verify doors/defrost cycles.
- Missing site in exports: verify filters and location mapping (location_id/external_id).
Need a hand?
Email adam@smartprobe.com.au or call 0410 557 727. Include device serial, location, and a screenshot if possible.
For urgent production incidents, flag severity in the subject (e.g., P1 – kitchen offline).